At Archbold Biological Station, we make a lot of maps. There are many uses for maps and we use them to support our mission of Research, Conservation, and Education. We look at maps to make management decisions for the species or landscape that we are studying, we create maps to help us solve research questions, and we share maps with the public and elected officials to explain environmental topics. GIS, or Geographic Information Systems, is the main tool used to look at, create, and share maps. Vivienne Sclater, GIS and Data Manager at Archbold Biological Station says, “GIS is a very powerful piece of computer software that allows you to look at many different aspects of a map at once. You have the freedom to visualize how things interact with each other within a specific landscape. GIS has many different applications, from determining the best location for a new branch of your store, to predicting where an endangered species might exist based on the environmental conditions in a location where you know it occurs”. GIS is very useful for conservation work and Archbold has been very active in the Society for Conservation GIS since they started over 20 years ago.
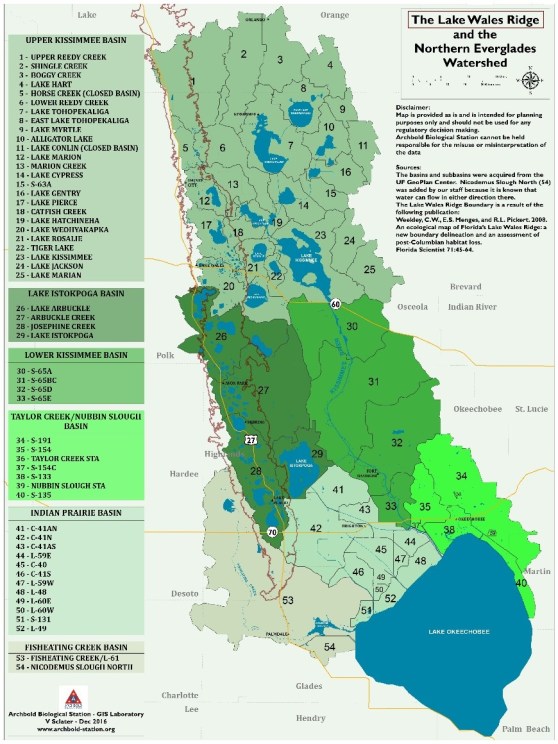
Example of a map made with GIS displaying the Lake Wales Ridge and the Headwaters of the Everglades Watershed.
Each year the Society for Conservation GIS, a group of conservation mappers from all over the world, meet in California to discuss how they are using GIS and mapping to help guide conservation. As a recent addition to the Society for Conservation GIS Board of Directors, Sclater says, “This year, attendees came from more than 15 different countries to celebrate with the Society as they held their 20th annual conference this July. There were many interesting topics presented this year that are applicable to Highlands County such as conservation planning, wildlife movements and modeling, ecosystem services and agriculture, habitat mapping, land cover change, the use of drones in conservation, restoration, and water quality analysis”. The Society for Conservation GIS also sponsors 20 international scholars each year to come to the US and receive training in conservation GIS for 5 weeks. They take this knowledge back to their local countries and conservation organizations. The Society for Conservation GIS not only supports the mission of Archbold in research and conservation, but also in education.

Group photo of attendees of the Society of Conservation GIS (SCGIS) annual conference in California. July 2017. Photo by Charles Convis.
Sclater plans to use some of the ideas she learned at this year’s conference with data from our region to help inform conservation decisions. “It is an amazing community to be a part of where people with similar interests and skillsets can discuss work they are doing and how it could be implemented in other areas,” Sclater continues. “When I was listening to the presentations, I couldn’t help but think of how I could do something similar with data that we have collected at Archbold”. While a lot of the presentations focus on larger landscapes, the majority focus on local conservation issues similar in scale to those we face in Highlands County. Archbold continues to be actively involved in the Society for Conservation GIS by sharing our conservation work with them, and learning from the many others doing similar work globally.
Society for Conservation GIS (SCGIS) logo for their 20th conference in July 2017.
